
The September 2016 State of Oregon Economic Indexes of was released today. Full report is available here. We thank KeyBank for their generous support of this project.
The Oregon economy continues to grow with further evidence that the pace of activity is moderating as the expansion matures. Highlights of this month’s report include:
- The Oregon measure of economic activity fell to 0.0 from an upwardly revised August figure of 1.0. Such sharp declines in the measure happen occasionally even during economic expansions. Consequently, it is important to watch the three-month moving average, which smooths month-to-month volatility in the measure. The moving average measure was 0.56, where “zero” indicates average growth over the 1990-present period.
- Employment components – which can be volatile – were largely responsible for holding down the measure in September. Broad indicators, however, signaled a still healthy labor market. Initial jobless claims in particular remain at very low levels historically consistent with continued job growth in the months ahead.
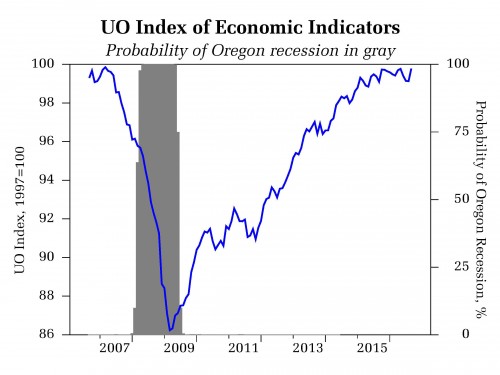
- The University of Oregon Index of Economic Indicators jumped 0.7% in September following an upwardly revised flat reading in August. In a positive development, employment services payrolls (largely temporary help employees) rose, easing concerns that this leading indicator was signaling an impending broad-based hiring slowdown.
- Core manufacturing orders remain soft as the sector struggles with the negative impact of lower oil prices and a stronger dollar. The recent gross domestic product report for the third quarter of this year revealed that an inventory correction plaguing the sector may be easing, opening the door to resumed manufacturing growth in the months ahead.
- Together, these indicators suggest ongoing growth in Oregon at an above average pace of activity. Note that the UO Index typically moves sideways as a business cycle matures.
