
In case you missed it, save the date for this year’s Oregon Economic Forum.
This is the University of Oregon State of Oregon Economic Indicators for April 2018. The release date is June 7, 2018. Special thanks to our sponsor, KeyBank.
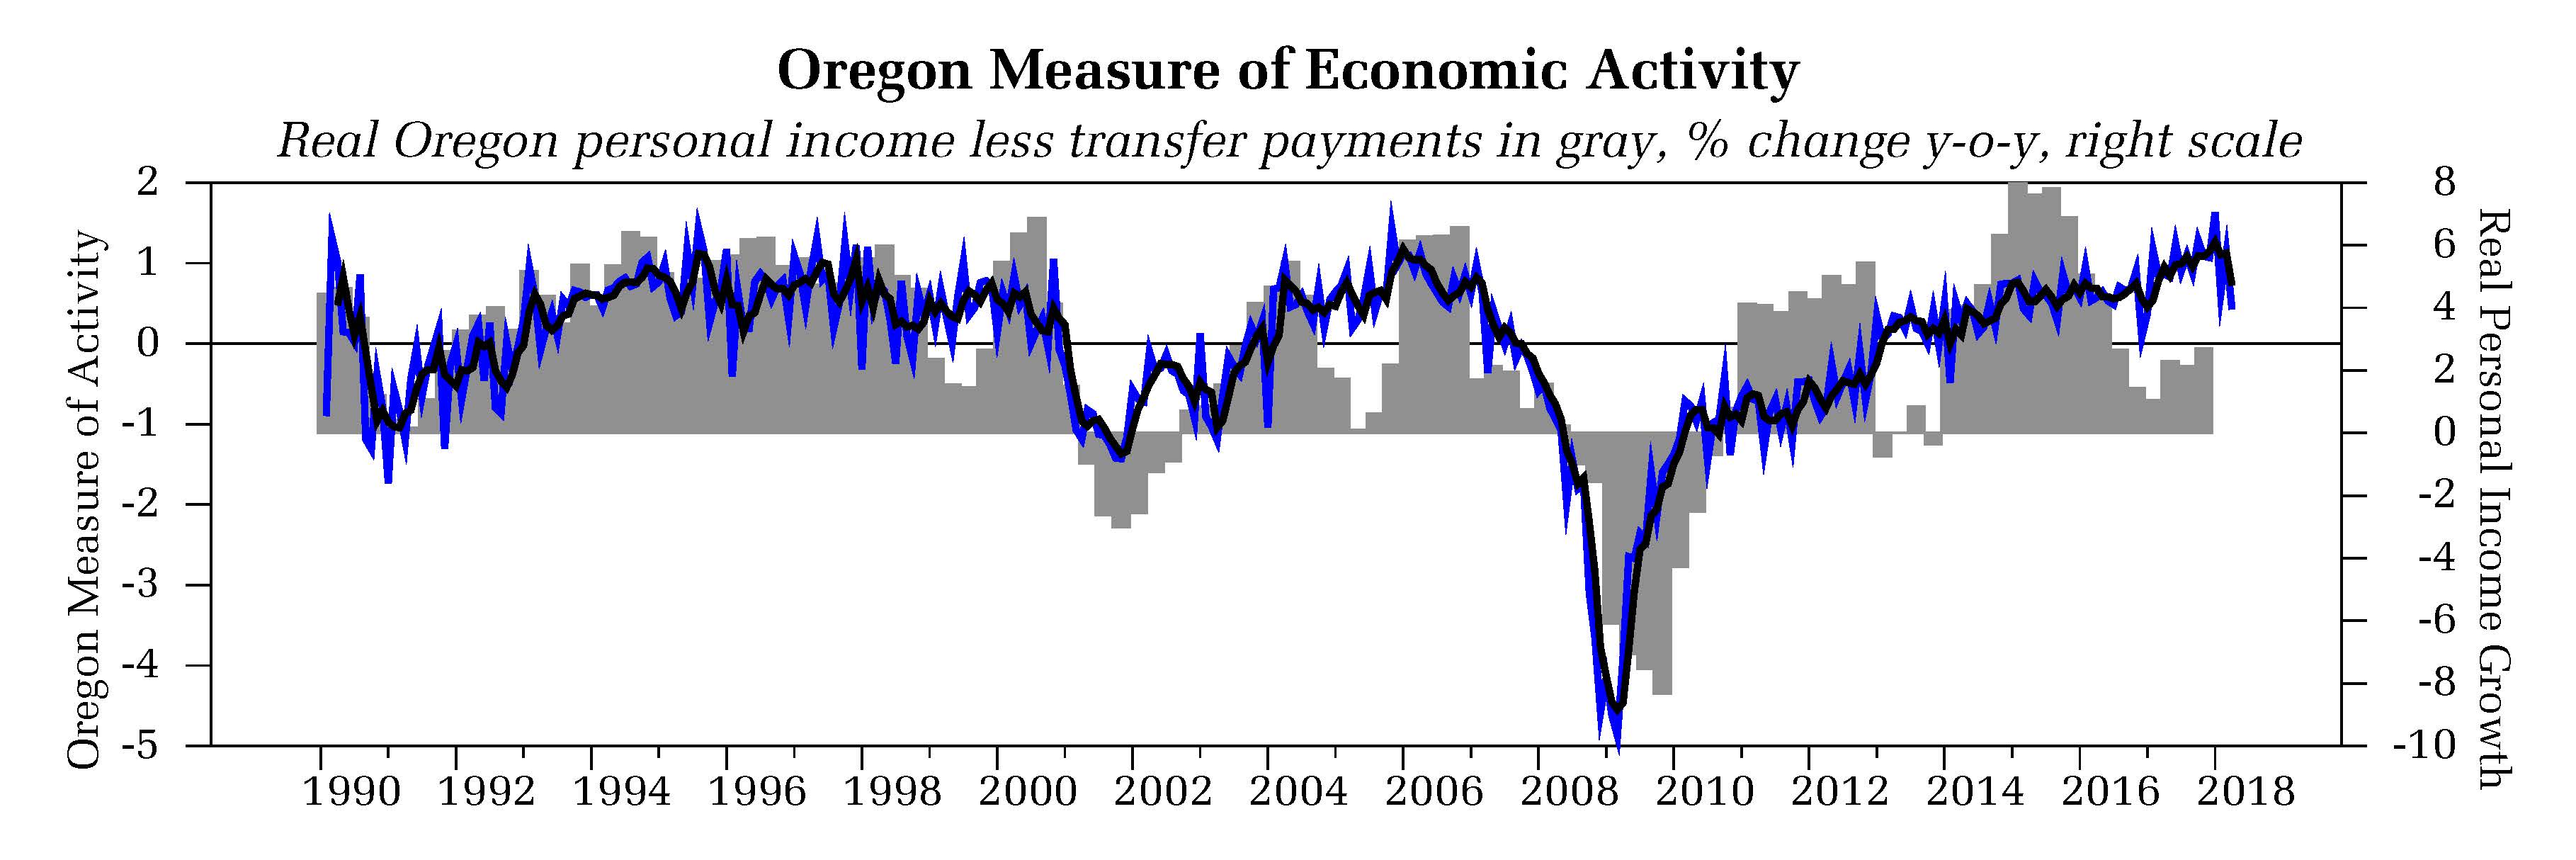
The Oregon Measure of Economic Activity fell in April to 0.43 from a March reading of 1.13. Highlights of this month’s report include:
- The moving average measure, which smooths out the volatility, fell to 0.72, well above average (“zero” indicates average growth over the 1990-present period). Data has cooled somewhat compared to late last year but remains indicative of a solid pace of growth.
- The manufacturing sector contributed positively; the sector currently benefits from a strong rebound from weakness in 2015-16. The household sector also made a positive contribution, but temporary employment and labor force components dragged down the gains.
- The University of Oregon Index of Economic Indicators edged down in April. Initial unemployment claims were flat while employment services payrolls, largely temporary help workers, fell.
- Building permits (smoothed) have been tracking at cycle highs of around 1,950 units permitted for the past three months. Consumer sentiment (smoothed) is likewise at cycle highs while new orders for core manufacturing goods continues to climb.
- The spread between long and short-term interest rates fell; the spread will likely continue to fall due to expected further tightening of monetary policy.
Together, these indicators suggest ongoing growth in Oregon at an above average pace of activity.
Note: This release incorporated revisions to new capital goods orders and the weight distance tax.
Media Contacts:
Tim Duy – 541.346.4660 (w)
