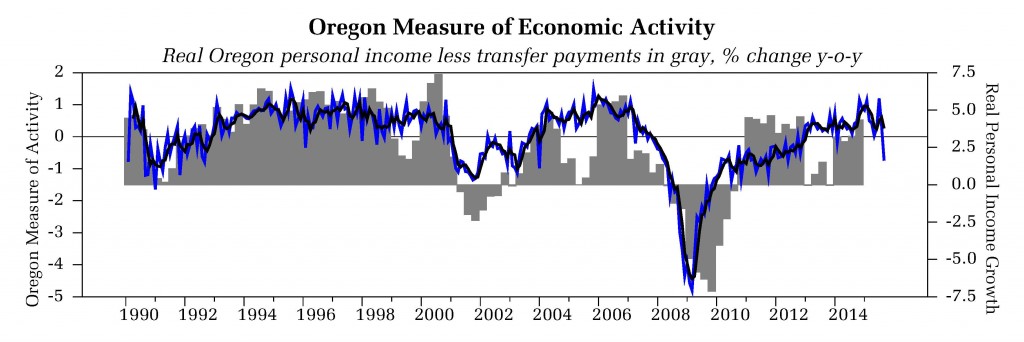
The September 2015 State of Oregon Economic Indexes of was released today. Full report is available here. We thank KeyBank for their generous support of this project.
Weak employment numbers dragged the Oregon Measure of Economic Activity deep into negative territory in September. Highlights of the report include:
- The three-month moving average, which smooths month-to-month volatility in the measure, remained above average (“zero” indicates average growth over the 1990-present period). Only the household sector contributed positively to this month’s measure.
- Employment components were primarily responsible for weakness across other sectors. Overall, nonfarm jobs in the state dipped by 5,300 according to the first release of the employment data. Such declines are very rare outside of recessions and are generally subsequently reversed when they occur during expansions.
- Still low levels of initial unemployment claims indicate that underlying labor market activity remains solid and consistent with additional job gains, suggesting that the September employment losses were an anomaly. Note also that employment data is subject to possible revisions.
- The University of Oregon Index of Economic Indicators fell 0.4% in September, the second decline in two months. Initial unemployment claims fell back to historically low levels. Employment services payrolls – mostly temporary help workers – fell.
- Residential building permits (smoothed) gained during the month; the housing sector overall continues its slow recovery. The Oregon weight distance tax (a measure of trucking activity) and average weekly hours worked both declined, reversing recent improvement in these measures.
Despite choppy data, the two indicators suggest ongoing growth in Oregon at an above average pace of activity. Note that the UO Index is likely too show more sideways movement characterized by occasional declines. The ongoing US economic expansion provides sufficient support to sustain Oregon’s economy for the foreseeable future.


