March 2016 Oregon Regional Indicators

The March 2016 State of Oregon Regional Economic Indexes of  was released today.  Full report is available here.  We thank KeyBank for their generous support of this project.

BendChartMar16

Oregon’s major metro regions continued to power forward in March. Highlights of the report include:

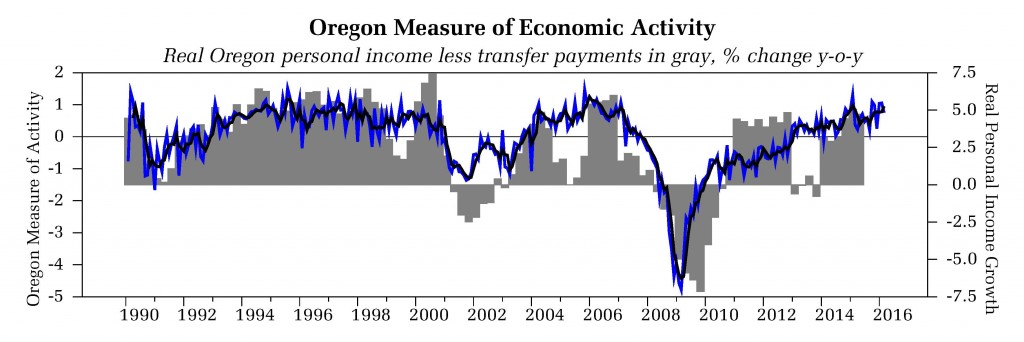
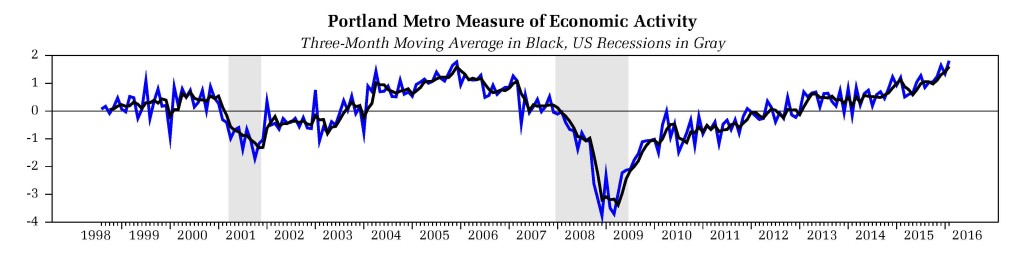
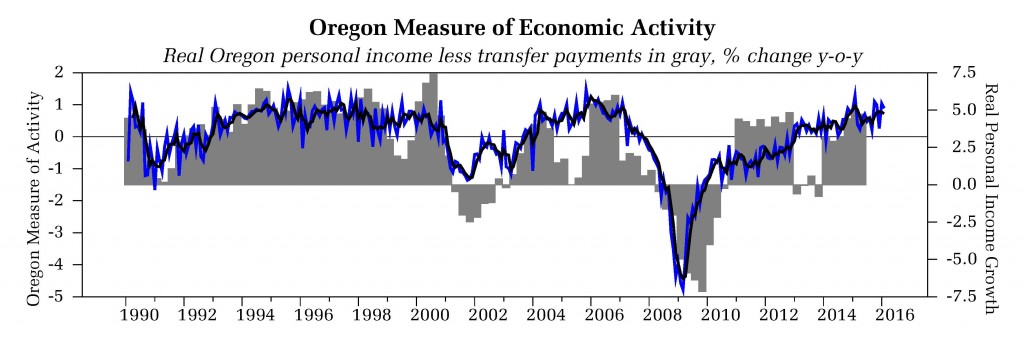
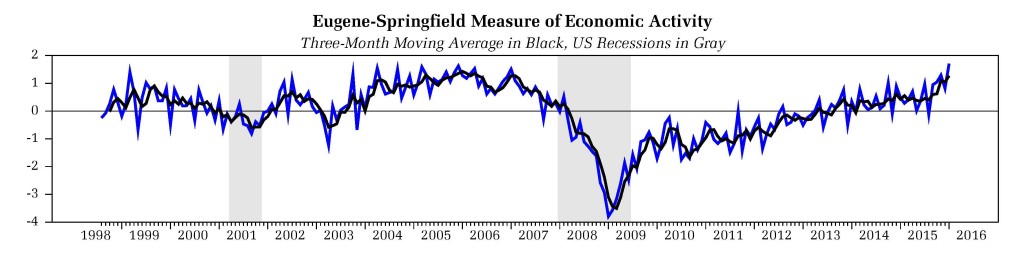
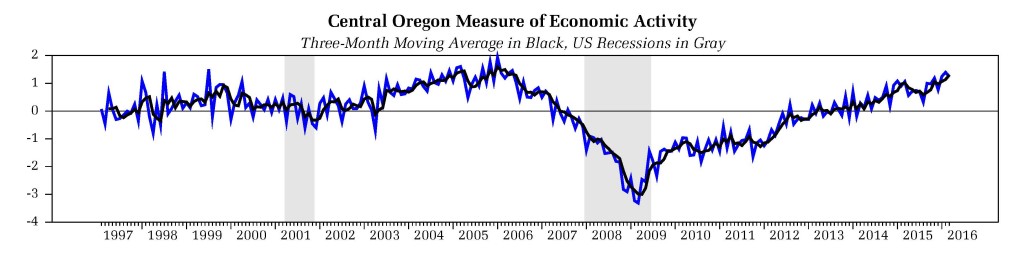
  • The measures for all regions indicate above average growth (both the March numbers and the moving average measures of activity, which smooth monthly volatility). Recall that “zero” for these measures indicates relative average growth; each region has its own underlying growth rate.
  • Home construction, measured by new housing permits, contributed positively to both the Portland metro and Central Oregon regions as activity in those areas edges closer to that normally experienced in expansions. Permits had a negative contribution in remaining regions. Home sales, however, are strong in all areas – indeed, in many cases we are seeing activity at levels similar to that experienced during the housing bubble that proceeded the last recession. It seems likely that more home construction will follow.
  • The Eugene-Springfield area experienced some choppier employment numbers this month, but this likely reflects normal volatility. Low initial unemployment claims – similar to other regions – indicates a solid underlying labor market.
  • Note low unemployment rates are providing a solid boost to the measures in all areas. More population and stronger economic activity are boosting municipal waste contributions to the measures.
  • The Salem measure pulled back from a housing-induced spike in February, but the solid upward underlying trend remains intact.

Reminder: The regional measures are prone to potentially large swings due to the volatility of some of the underlying data, particularly measures of employment. The moving average measures smooth out much of that volatility.

March 2016 State of Oregon Economic Indicators

The March 2016 State of Oregon Economic Indexes of  was released today.  Full report is available here.  We thank KeyBank for their generous support of this project.

Chart1Mar16

The Oregon economy continues to charge forward even as manufacturing indicators softened in March. Highlights of the report include:

  • The Oregon measure of economic activity was down from an upwardly revised February number, while the three-month moving average, which smooths month-to-month volatility in the measure, rose to 0.95, where “zero” indicates average growth over the 1990-present period.
  • Similar to February, the manufacturing sector contributed negatively. Firms heavily exposed to a stronger dollar or the energy sector continue to struggle. The construction sector also weighed on the measure, although building permits contributed positively during the month. Still, single-family housing remains soft relative to past expansions.
  • Both the household and construction sectors contributed positively to the measure. Employment components in particular remain solid. Both consumer confidence and equity prices also remain supportive.
  • The University of Oregon Index of Economic Indicators was flat for the month. The UO Index has been largely flat since last October; such periods of fairly little change often occur during more mature economic expansions.
  • Residential building permits rose to their highest level since 2007 as the sector continues its slow but steady improvement. Remaining indicators were again mostly flat. The interest rate spread widened in response to firmer financial conditions and reduced risk of recession.

These two indicators suggest ongoing growth in Oregon at an above average pace of activity. The ongoing US economic expansion provides sufficient support to sustain Oregon’s economy for the foreseeable future.