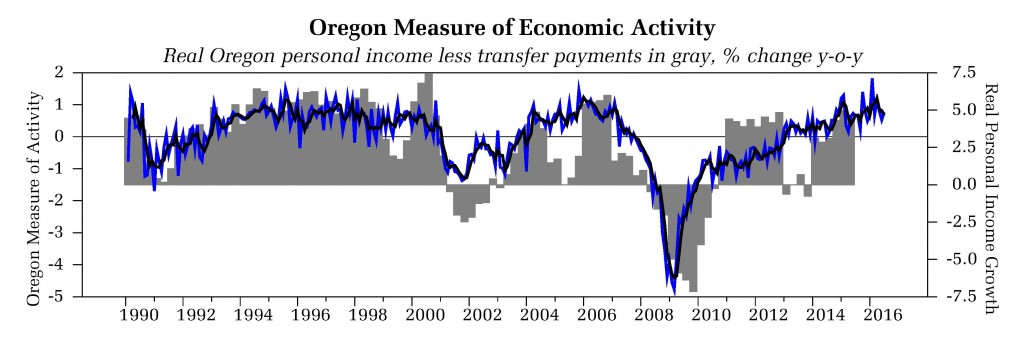
The July 2016 State of Oregon Economic Indexes of was released today. Full report is available here. We thank KeyBank for their generous support of this project.

July saw some mixed numbers for the Oregon economy; the overall tenor of the data is consistent an economy in the mature stage of a business cycle. Highlights of this month’s report include:
- The Oregon measure of economic activity rose to 0.76 from a downwardly adjusted revised June figure of 0.53. The three-month moving average, which smooths month-to-month volatility in the measure was 0.69, where “zero” indicates average growth over the 1990-present period.
- The manufacturing sector made a neutral contribution to the measure as a gain in the employment component was offset by a decline in hours worked. Weak employment sapped the construction component. Note that housing permits were slightly positive as they are near their average level; permits, however, remain low compared to a typical expansion.
- The University of Oregon Index of Economic Indicators fell 0.5% in July, but as was the case last month, the previou number was revised upwards. Most indicators were generally unchanged to modestly softer compared to June.
- Employment services payrolls (largely temporary help_ edged down and remains in a general sideways direction. This behavior is typical during the mature phase of a business cycle. The Oregon weight distance tax, a measure of trucking activity, declined. It too has been tracking sideways for the past year.
- Core manufacturing orders (a national number), edged up but remain in a downward trend. The malaise in manufacturing precipitated by the stronger dollar and decline in oil prices continues.
Together, these indicators suggest ongoing growth in Oregon at an above average pace of activity. The UO Index typically moves sideways as a business cycle matures. Consequently, occasional declines are not to be unexpected. Sharp declines across a wide swath of indicators would be more cause for concern.

