
The April 2017 State of Oregon Economic Indexes was released today. Full report is available here. We thank KeyBank for their generous support of this project.
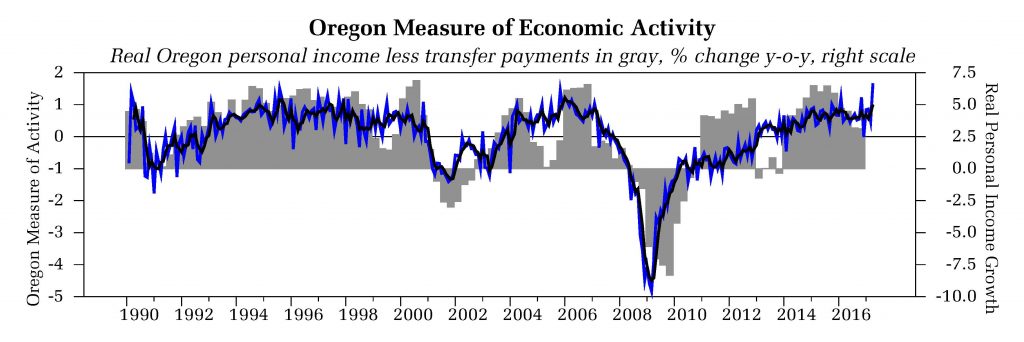
Solid employment data helped propel the Oregon measure of economic activity higher from 0.48 in March to 1.67 in April. Highlights of the report include:
- Recall that when analyzing these numbers that, due to volatility of index components, it is important to follow the underlying trends. The three-month moving average was 1.0 (“zero” indicates average growth over the 1990-present period), consistent with readings from past economic expansions in Oregon.
- The manufacturing sector made a positive contribution as the impacts of the 2015/6 slowdown wane. New housing permits made a negative contribution; new housing construction remains anemic relative to past expansions.
- Solid employment indications – both broad measures of labor market activity and components by sector – helped support the household and services sectors of the economy.
- The University of Oregon Index of Economic Indicators fell 0.4% in in April, the first decline since last December.
- Initial unemployment claims edged up but remain near historical lows. Employment services payrolls (mostly temporary help jobs) rose again and are 7.9% higher than a year ago. In the past, such gains foreshadowed further gains in overall employment.
- Residential building permits (smoothed) and the Oregon Weight Distance tax, a measure of trucking activity both dipped. Core manufacturing orders for capital goods was virtually unchanged while average weekly hours worked by employees in Oregon manufacturing rose.
Together, these indicators suggest ongoing growth in Oregon at an above average pace of activity.
