September 2017 Oregon Regional Economic Indicators

The University of Oregon Regional Economic Indexes for September 2017 was released today, November 20, 2017. We thank KeyBank for their generous support of this project.

Link to full report here.

Regional activity across Oregon’s major metropolitan areas remains at a pace consistent with previous expansions. Highlights of this month’s report include:

  • For all regions covered by this report, moving average measures (which smooth monthly volatility) remain above zero, indicating above trend activity.
  • The Portland metro area looks to have lost some momentum in recent months, but watch for downward revisions of jobs numbers that reduces the reported strength in the first part of this year. This would suggest that for this cycle, Portland’s growth peaked in late 2015 and early 2016.
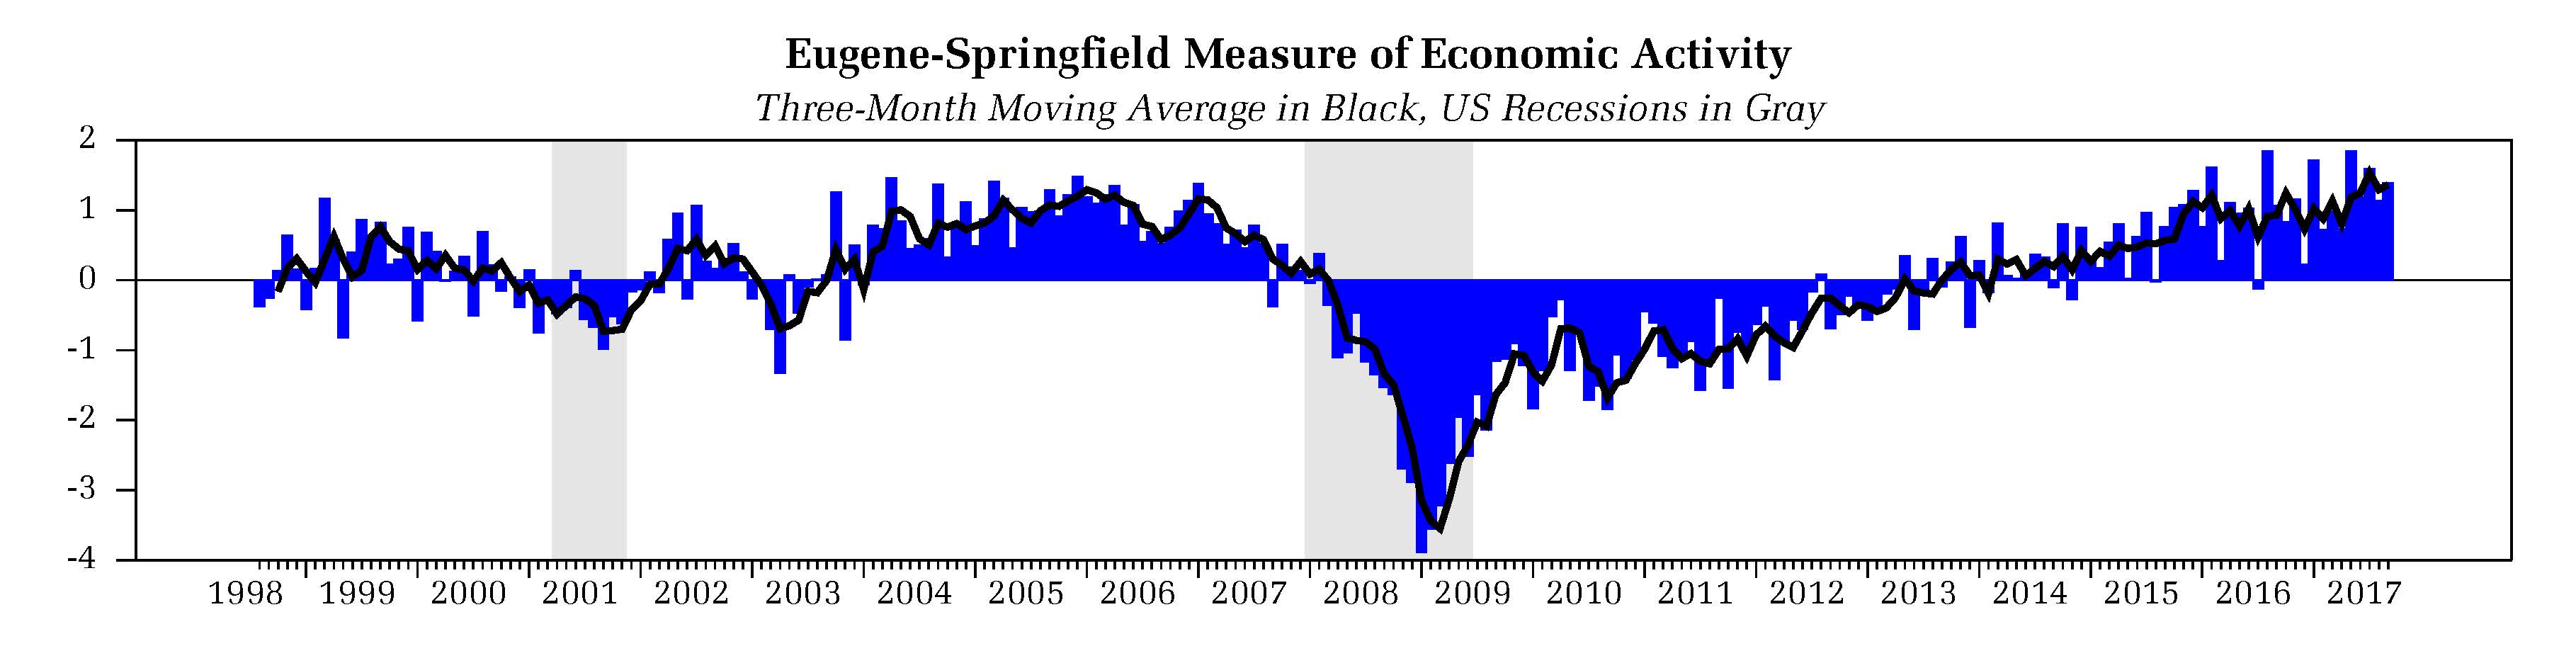
  • Jobs numbers also boosted the Eugene-Springfield measures this year; revisions may reveal a somewhat more subdued pace of activity more consistent with that of 2016. Salem’s numbers have held consistently strong for almost two years.
  • The pace of activity in Central Oregon appears to be moderating somewhat this year, but still indicates a healthy pace of activity.
  • Note that some slowing in the pace of activity is expected as the economy is now in a more mature stage of the business cycle.

Media Contacts:

Tim Duy – 541.346.4660 (w)

September 2017 Statewide Economic Indicators

The University of Oregon State of Oregon Economic Indicators for September 2017 was released today. The release date is November 1, 2017. Special thanks to our sponsor, KeyBank

Link to full report here.

A second consecutive weak jobs report weighed on the Oregon Measure of Economic Activity in September while the August measure was revised upward into positive territory. Highlights of this month’s report include:

  • The three-month moving average stood at 0.67, still in expansionary territory (“zero” indicates average growth over the 1990-present period). Similar to August, of the four major sectors comprising the index, only the service sector, containing only employment components, made a negative contribution to the measure.
  • Although the Oregon Employment Department reported a second month of job losses in Oregon, the low level of initial unemployment claims indicates a still solid job market. Note that the employment data is subject to sometimes large revisions.
  • The University of Oregon Index of Economic Indicators fell again in September. The UO index fell in four of the last six months and has tracked sideways almost all year. This behavior is consistent with that of an economy in a mature expansion.
  • Softer employment services payrolls (largely temporary employment) and initial unemployment claims weighed on the measure; the latter remains near historic lows and suggests ongoing job growth.
  • Core (nondefense, nonaircraft) manufacturing new orders made a solid gain, extending the recent upward trend and indicating a clear rebound in spending on business equipment. Building permits (smoothed) rose rose while remaining components were little changed.

Together, these indicators suggest ongoing growth in Oregon at an above average pace of activity.

Media Contacts:
Tim Duy – 541.346.4660 (w)

August 2017 Oregon Regional Economic Indicators

The August 2017 Oregon Regional Economic Indicators  was released October 25, 2017.  Full report is available here.  We thank KeyBank for their generous support of this project.

Oregon Economic Forum:

We look for forward to seeing you at tomorrow’s event!

Thursday, October 26, 2017
Portland Marriott Downtown Waterfront
1401 SW Naito Pkwy, Portland, OR 97201
Program runs from 745am to 11am
Doors open at 700am for breakfast

Oregon Regional Economic Indicators:

Weakness in labor components weighed on the regional measures of activity in August, but this was partially often offset with strength in other components. Highlights of this month’s report include:

  • Overall, for all regions covered by this report moving average measures (which smooth monthly volatility) remain above zero, indicating above trend activity.
  • Some weakness in the local level numbers was expected given statewide job losses reported for August. Leisure and hospitality employment, for example, was neutral or negative for four of the five regions covered here.
  • Note that employment data is often revised; we may see some earlier strength in the numbers revised down to smooth the series and reducing the reported acceleration in activity earlier in the year.
  • Overall, the combination of softening employment in the context of a still solid economy measured by other indicators such as low initial unemployment claims suggests that economic activity may be constrained by supply side factors, particularly a smaller pool of available workers.