December 2017 Statewide Economic Indicators

This is the University of Oregon State of Oregon Economic Indicators for December 2017. The release date is February 6, 2018. Special thanks to our sponsor, KeyBank

Link to full report here.

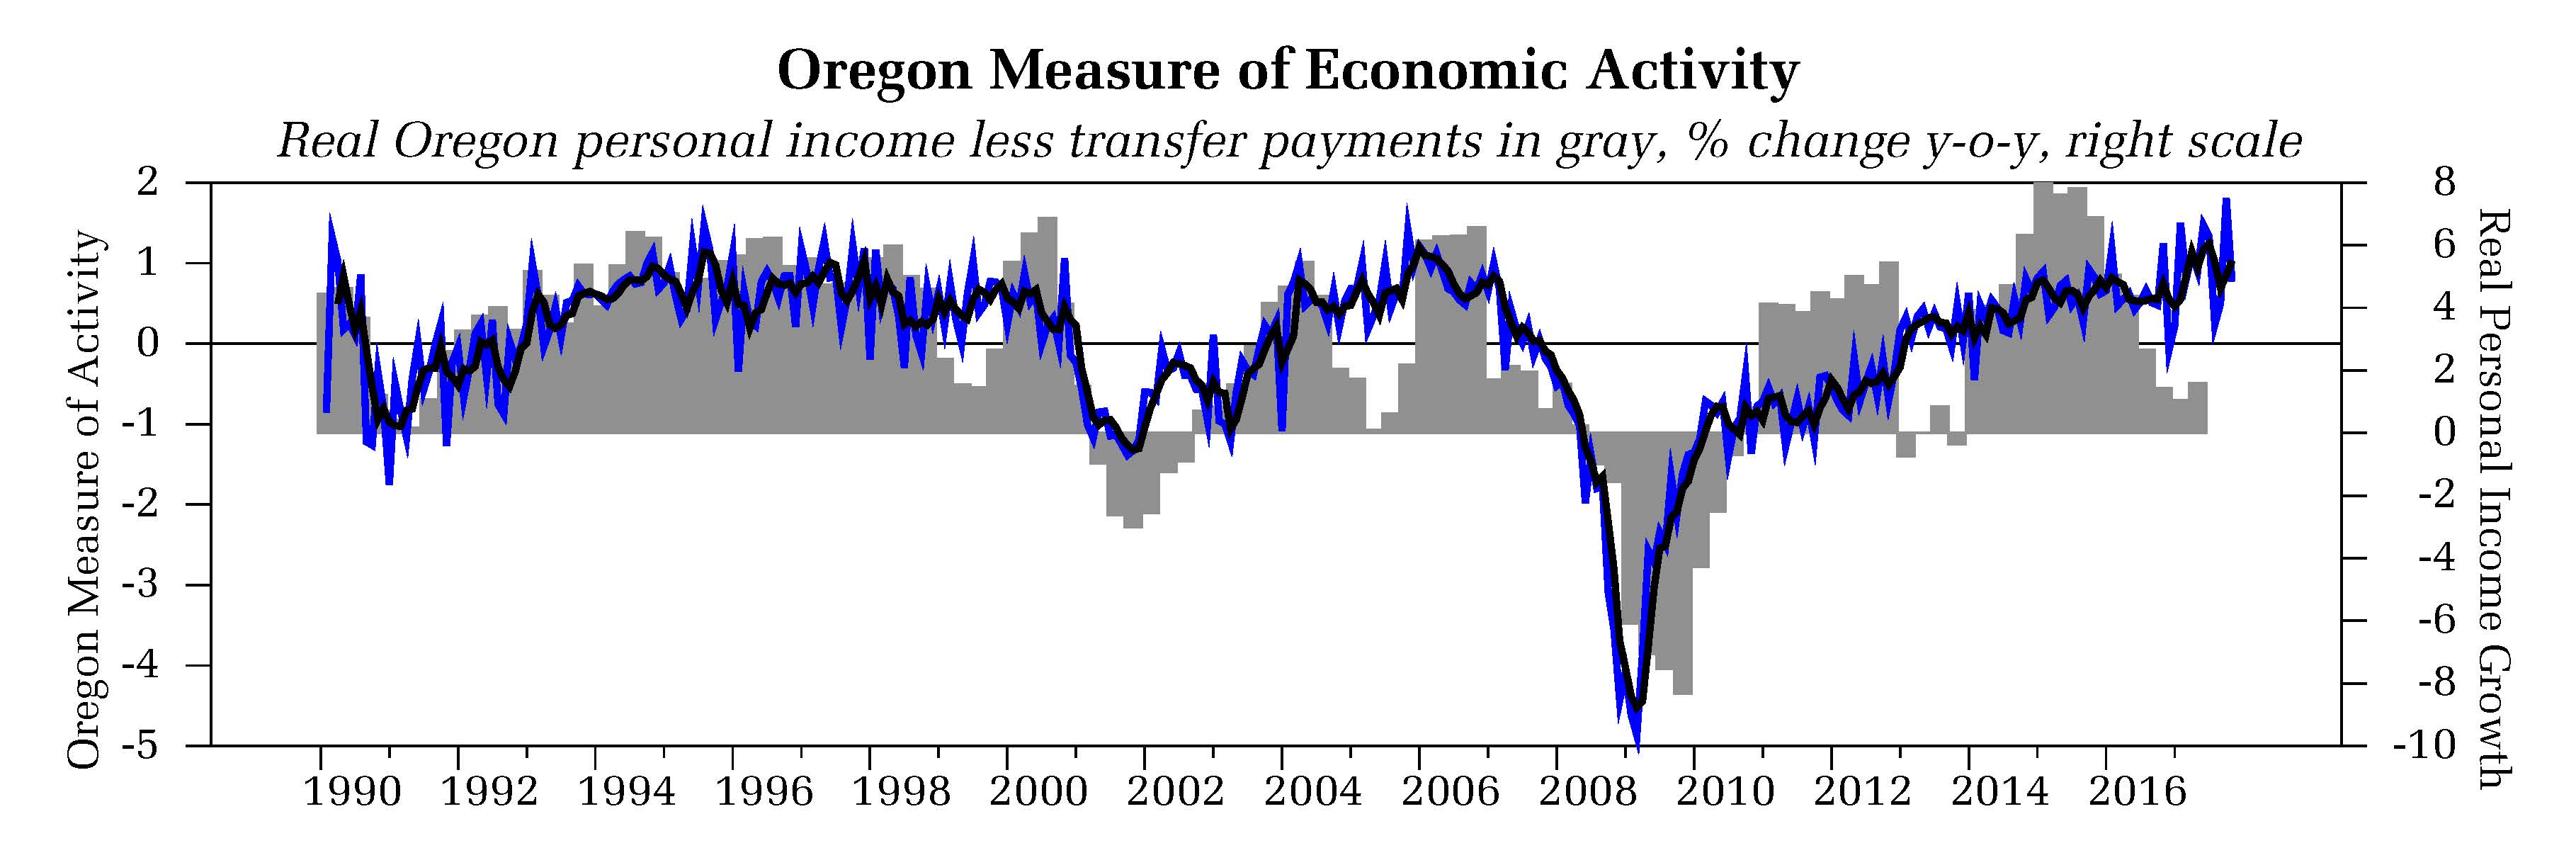
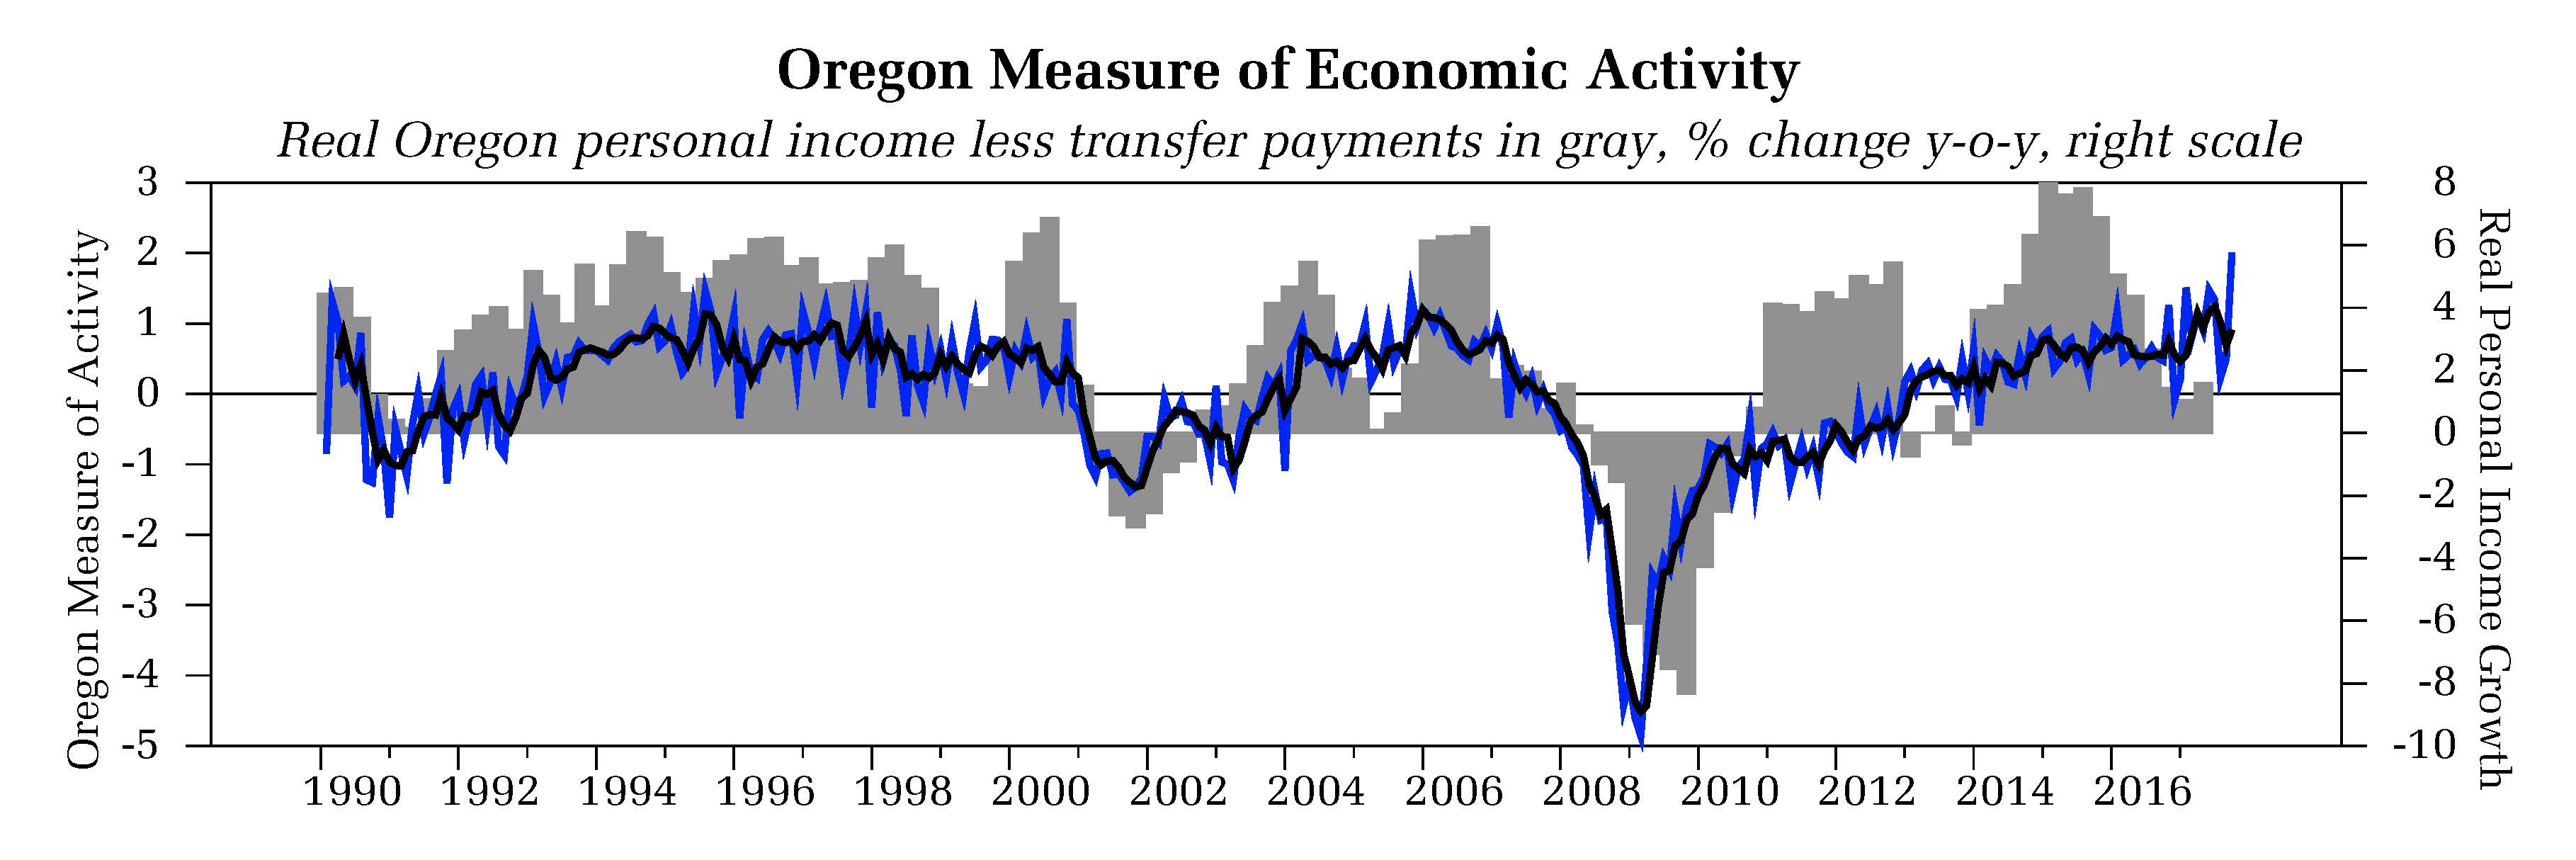
The Oregon Measure of Economic Activity snapped higher in December of last year, continuing a volatile pattern that has become a characteristic of the measure in recent months. Highlights of this month’s report include:

  • The moving average measure, which smooths out the volatility, rose to 1.61, a record high relative to previous expansions (“zero” indicates average growth over the 1990-present period). All sectors covered contributed positively to the measure, but strength was driven by the employment components.
  • The Oregon Department of Employment estimated job growth of 14,700 for December. Future revisions may smooth the recent job growth numbers, but if the numbers hold they suggest that Oregon’s economy strengthened toward the end of the year.
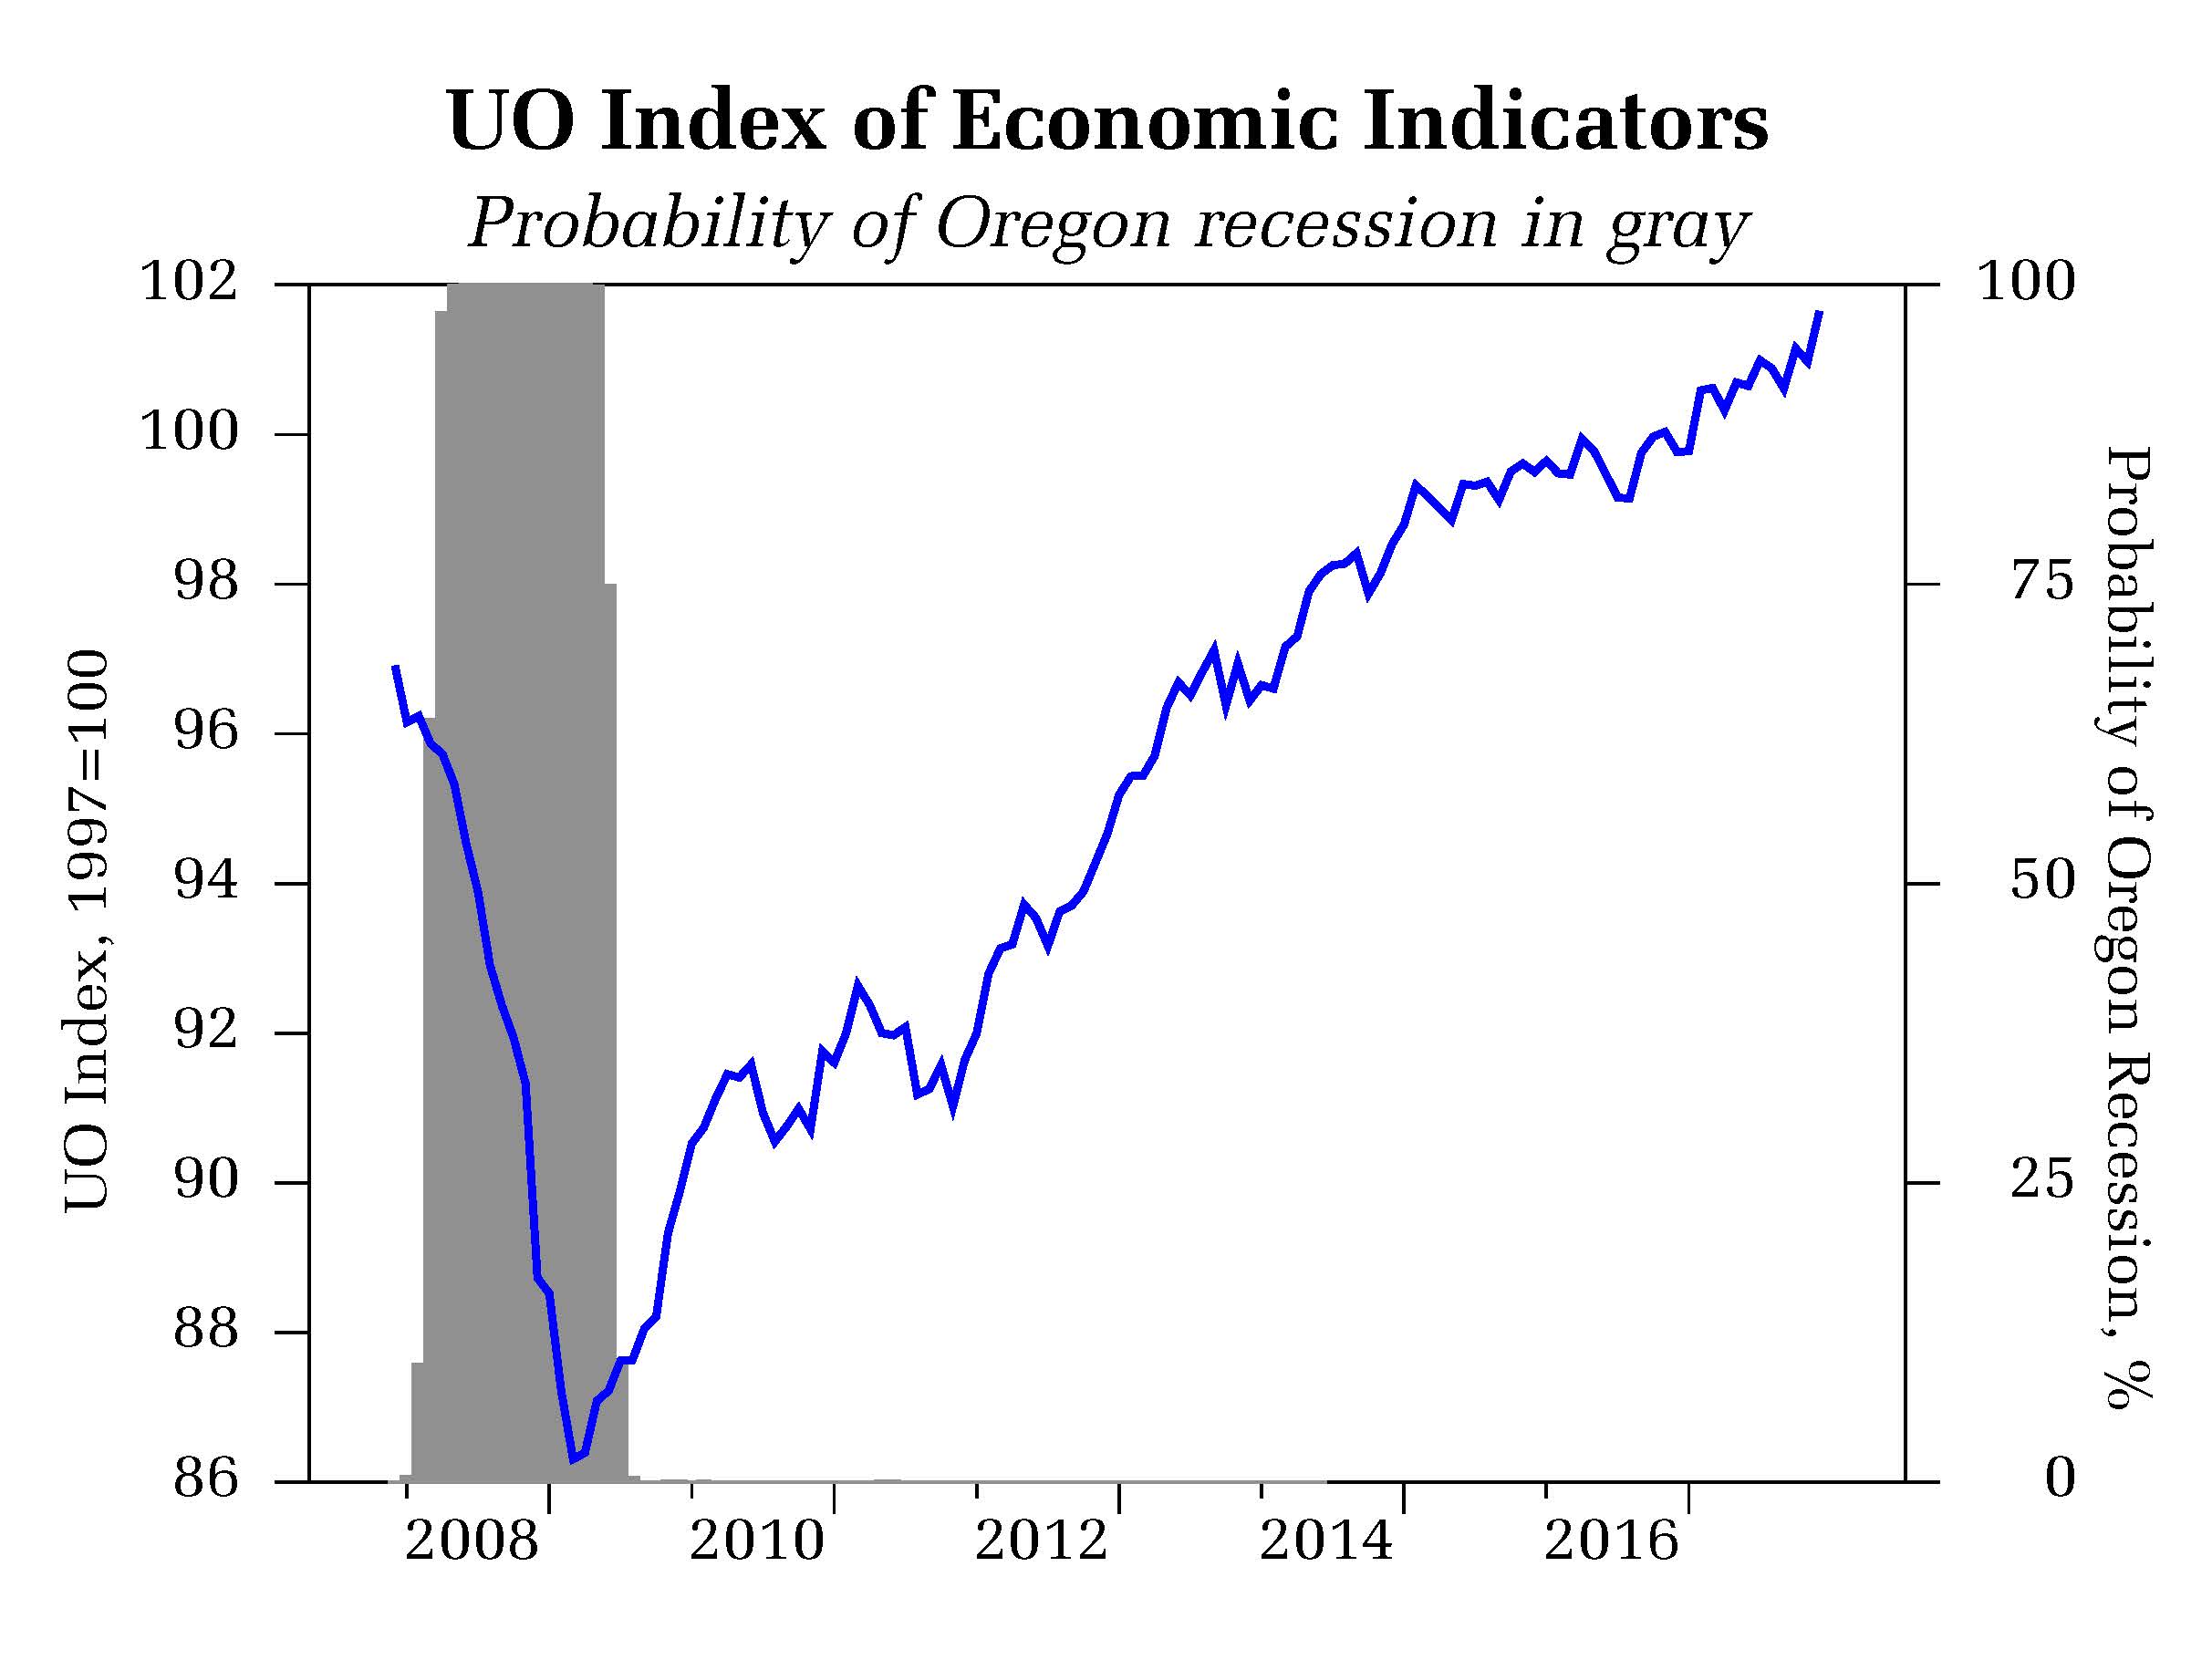
  • The University of Oregon Index of Economic Indicators rose in December; a general uptrend in the index continues despite the expansion reaching a more mature phase in which we would expect more sideways movement.
  • Employment services (mostly temporary help workers) rose while initial unemployment claims fell to a fresh low. Firms are seeing strong demand for their goods and services and consequently the pace of layoffs continues to decline.
  • Building permits (smoothed) rose as construction picks up to a pace more consistent with that of past expansions. Consumer confidence edged higher while manufacturing and traded goods indicators (new orders for core capital goods, hours worked in manufacturing, and the Oregon weight distance tax) remained largely unchanged.

Together, these indicators suggest ongoing growth in Oregon at an above average pace of activity.

Media Contacts:

Tim Duy – 541.346.4660 (w)

November 2017 Oregon Regional Economic Indicators

The University of Oregon Regional Economic Indexes for November 2017 was released today, January 24, 2018. We thank KeyBank for their generous support of this project.

Click here for full report.

The economic outlook remains bright for Oregon’s major metropolitan areas. Highlights of this month’s report include:

  • The Portland metro area shows some signs of a moderating pace of growth, which is not surprising given the length of the recovery and the already low level of unemployment.
  • Still, the low level of initial unemployment claims foreshadows continued job growth in the region, although the pace will likely be slower than earlier in the expansion. Indeed, slowing job growth is evident across all regions.
  • The Eugene-Springfield measure remains buoyed by solid labor market metrics and housing sales; new housing construction remains weak compared to past cycles. The Central Oregon region maintains a solid overall pace of activity.
  • The Rogue Valley continues to show steady growth with very low unemployment but persistently weak levels of new home construction. The Salem measures was supported by a rapid pace of home sales and low unemployment.

Media Contacts:
Tim Duy – 541.346.4660 (w)

November 2017 Oregon Statewide Economic Indicators

This is the University of Oregon State of Oregon Economic Indicators for November 2017. The release date is January 10, 2018. Special thanks to our sponsor, KeyBank

Link to full report here.

The Oregon Measure of Economic Activity fell back in November after jumping higher the previous month.  Highlights of this month’s report include:

  • The decline was largely anticipated; fairly volatile employment data created large movements in the measure in recent months that overstates the volatility of the economy. The moving average measure, which smooths out the volatility, continues to track near a value of roughly 1.0, consistent with previous expansions but somewhat below the pace of earlier this year (“zero” indicates average growth over the 1990-present period).
  •  All sectors covered contributed positively to the measure. Weakness was largely contained to the employment indicators.
  • The University of Oregon Index of Economic Indicators edged down in November after a solid gain the previous month.
  • Employment services (mostly temporary help workers) declined modestly, while initial unemployment claims edged higher. The latter remains at a very low level consistent with solid job growth.
  • For the most part, changes in individual index components were modest.

Together, these indicators suggest ongoing growth in Oregon at an above average pace of activity.

Media Contacts:

Tim Duy – 541.346.4660 (w)

October 2017 Oregon Regional Economic Indicators

The University of Oregon Regional Economic Indexes for October 2017 was released today, December 29, 2017. We thank KeyBank for their generous support of this project.

Click here for full report.

Oregon’s major metropolitan areas entered the final quarter of 2017 on solid footing. Highlights of this month’s report include:

  • For all regions covered by this report, both raw and moving average measures (which smooth monthly volatility) remain above zero, indicating above trend pace of activity.
  • Housing numbers maintain the patterns of recent years, with solid sales activity across all regions yet tepid new construction activity.
  • While both the Portland and Central Oregon regions have seen housing activity close to somewhat above normal (a contribution of 0 to the measure), remaining areas have remained below normal as gains in the numbers on the back of a surge in multi-family permits, such as Salem this month, prove to be largely temporary.
  • Employment activity has been generally solid across regions and industries. Moreover, the solid job growth has contributed to sharply lower unemployment rates, generating large contributions to all measures. Low initial unemployment claims suggest employers will continue to add jobs.
  • Still, job growth is slowing statewide as the expansion matures; regions are likely at or past peak growth rates for this cycle although there is no indication the economic expansion that began in 2009 will end this year.

Media Contacts:
Tim Duy – 541.346.4660 (w)

October 2017 Statewide Economic Indicators

This is the University of Oregon State of Oregon Economic Indicators for October 2017. The release date is December 4, 2017. Special thanks to our sponsor, KeyBank

Link to full report here.

The Oregon Measure of Economic Activity bounced higher in October on the back of surging job gains.  Highlights of this month’s report include:

  • Note that the jobs numbers have been very volatile in recent months and not likely reflective of the underlying pace of activity in Oregon. Consequently, it is important to follow the three-month moving average, which smooths monthly volatility. The moving average measure has been tracking at a more subdued value of roughly 1.0, consistent with previous expansions but somewhat below the pace of earlier this year (“zero” indicates average growth over the 1990-present period).
  • Aside from the employment components, a number of factors contributed positively to the measure. In particular, manufacturing rebounded solidly this year while broad labor market indicators such as the unemployment rate, labor force growth, and initial unemployment claims remain indicative of underlying economic stress.
  • The University of Oregon Index of Economic Indicators rose in October, offsetting the weakness of the past two months.
  • Employment services (mostly temporary help workers), average weekly hours worked in manufacturing, consumer sentiment (smoothed), and the interest rate spread all contributed to the rise in the Index.
  • Initial unemployment claims hover near historic lows and suggests ongoing job growth. Remaining components were little changed.

Together, these indicators suggest ongoing growth in Oregon at an above average pace of activity.

Media Contacts:

Tim Duy – 541.346.4660 (w)