


January 2018 Oregon Regional Economic Indicators
Good morning. This is the University of Oregon Regional Economic Indexes for January 2018. The release date is today, April 2, 2018. We thank KeyBank for their generous support of this project.
Oregon Regional Economic Indicators:

Regional economies continued to show strength as 2018 began. Highlights of this month’s report include:
Inflation Still Soft
Consumer price inflation eased back from the January spike, silencing concerns that inflation would soon make a comeback. This will help keep the Fed focused on its gradual tightening path. If they want to shift gears, they will have to look elsewhere.
Core CPI decelerated in February to 0.2 percent month-over-month, compared to a 0.3 percent gain the previous month. The annualize monthly gain was 2.2 percent. Be wary of reading too much into the three-month gain of 3.1 percent as that will quickly come down if the monthly readings stay low.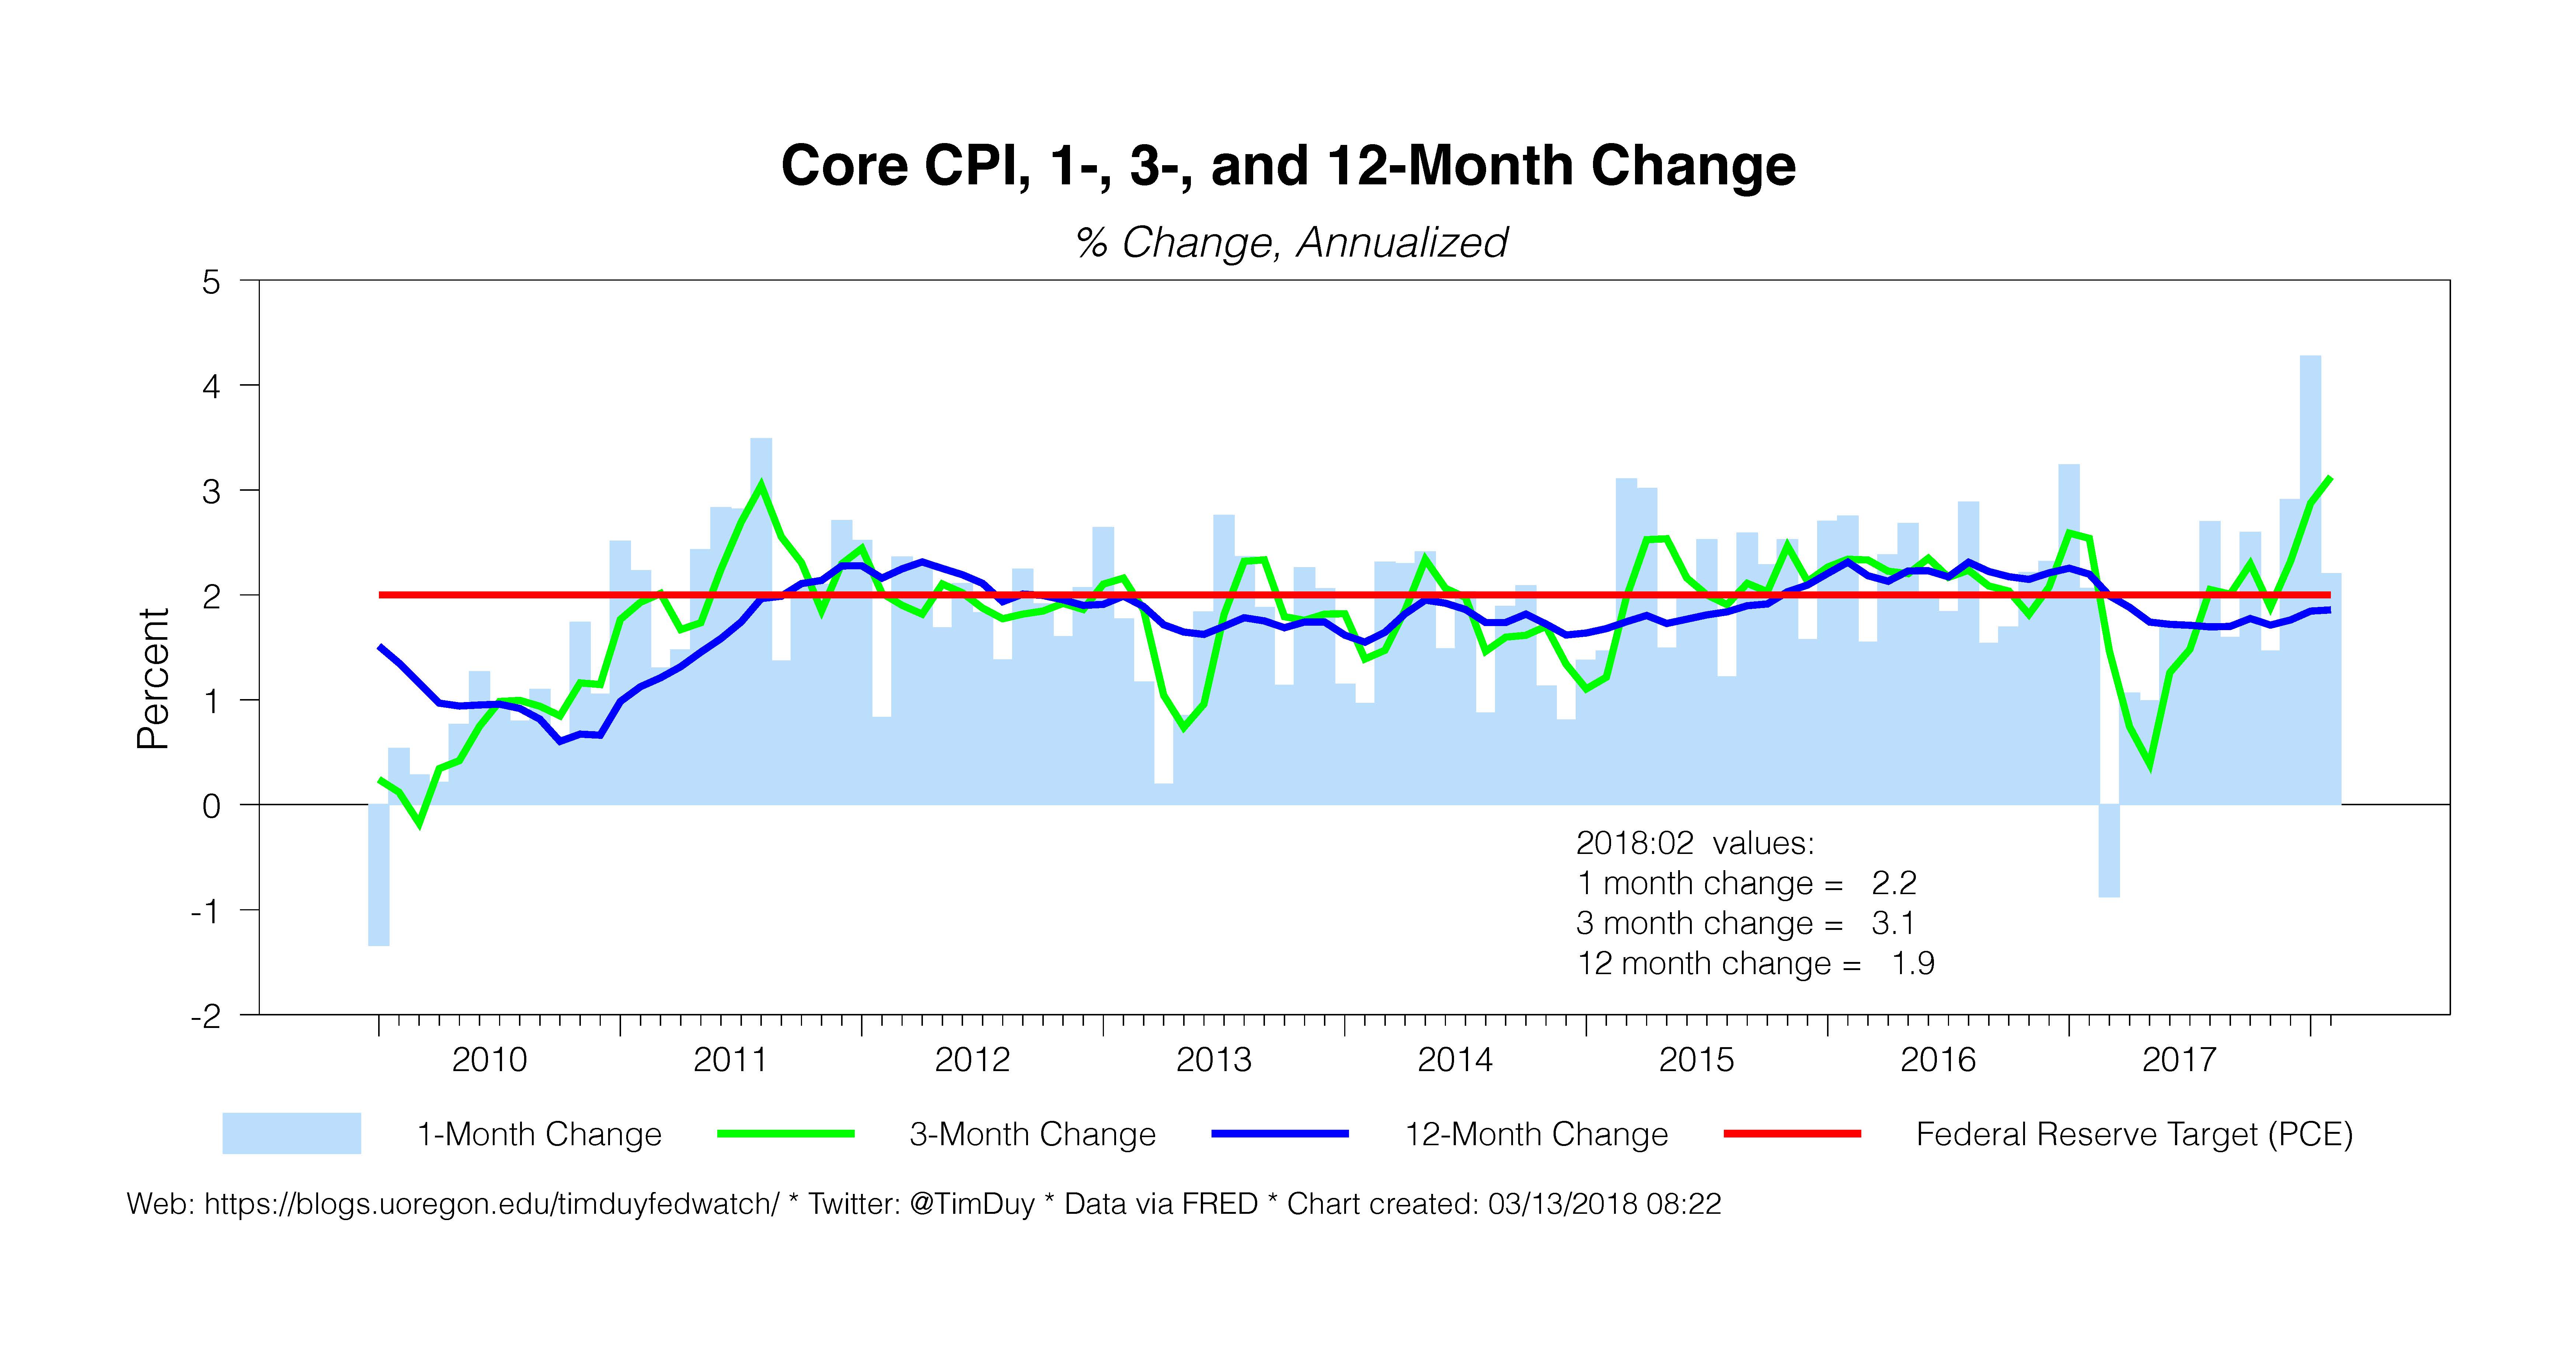
It is worth considering that the stronger December and January numbers reflected some unaccounted for seasonal factors. Given the low inflation environment, the numbers of times firms change prices during the year decreases, and the timing of those changes are concentrated around the beginning of the year (a natural time to change prices). If so, then the December and January numbers were largely transitory.
Two additional points in this quick post. First, with multifamily housing starts holding strong, gradually declining shelter inflation will likely continue to weigh on overall inflation. Second, PCE inflation, the Fed’s actual inflation target, traditionally runs roughly 50bp below core. So a 2.2 percent core CPI inflation implies something like 1.8 percent core PCE inflation. That is still weak relative to the Fed’s two percent inflation target.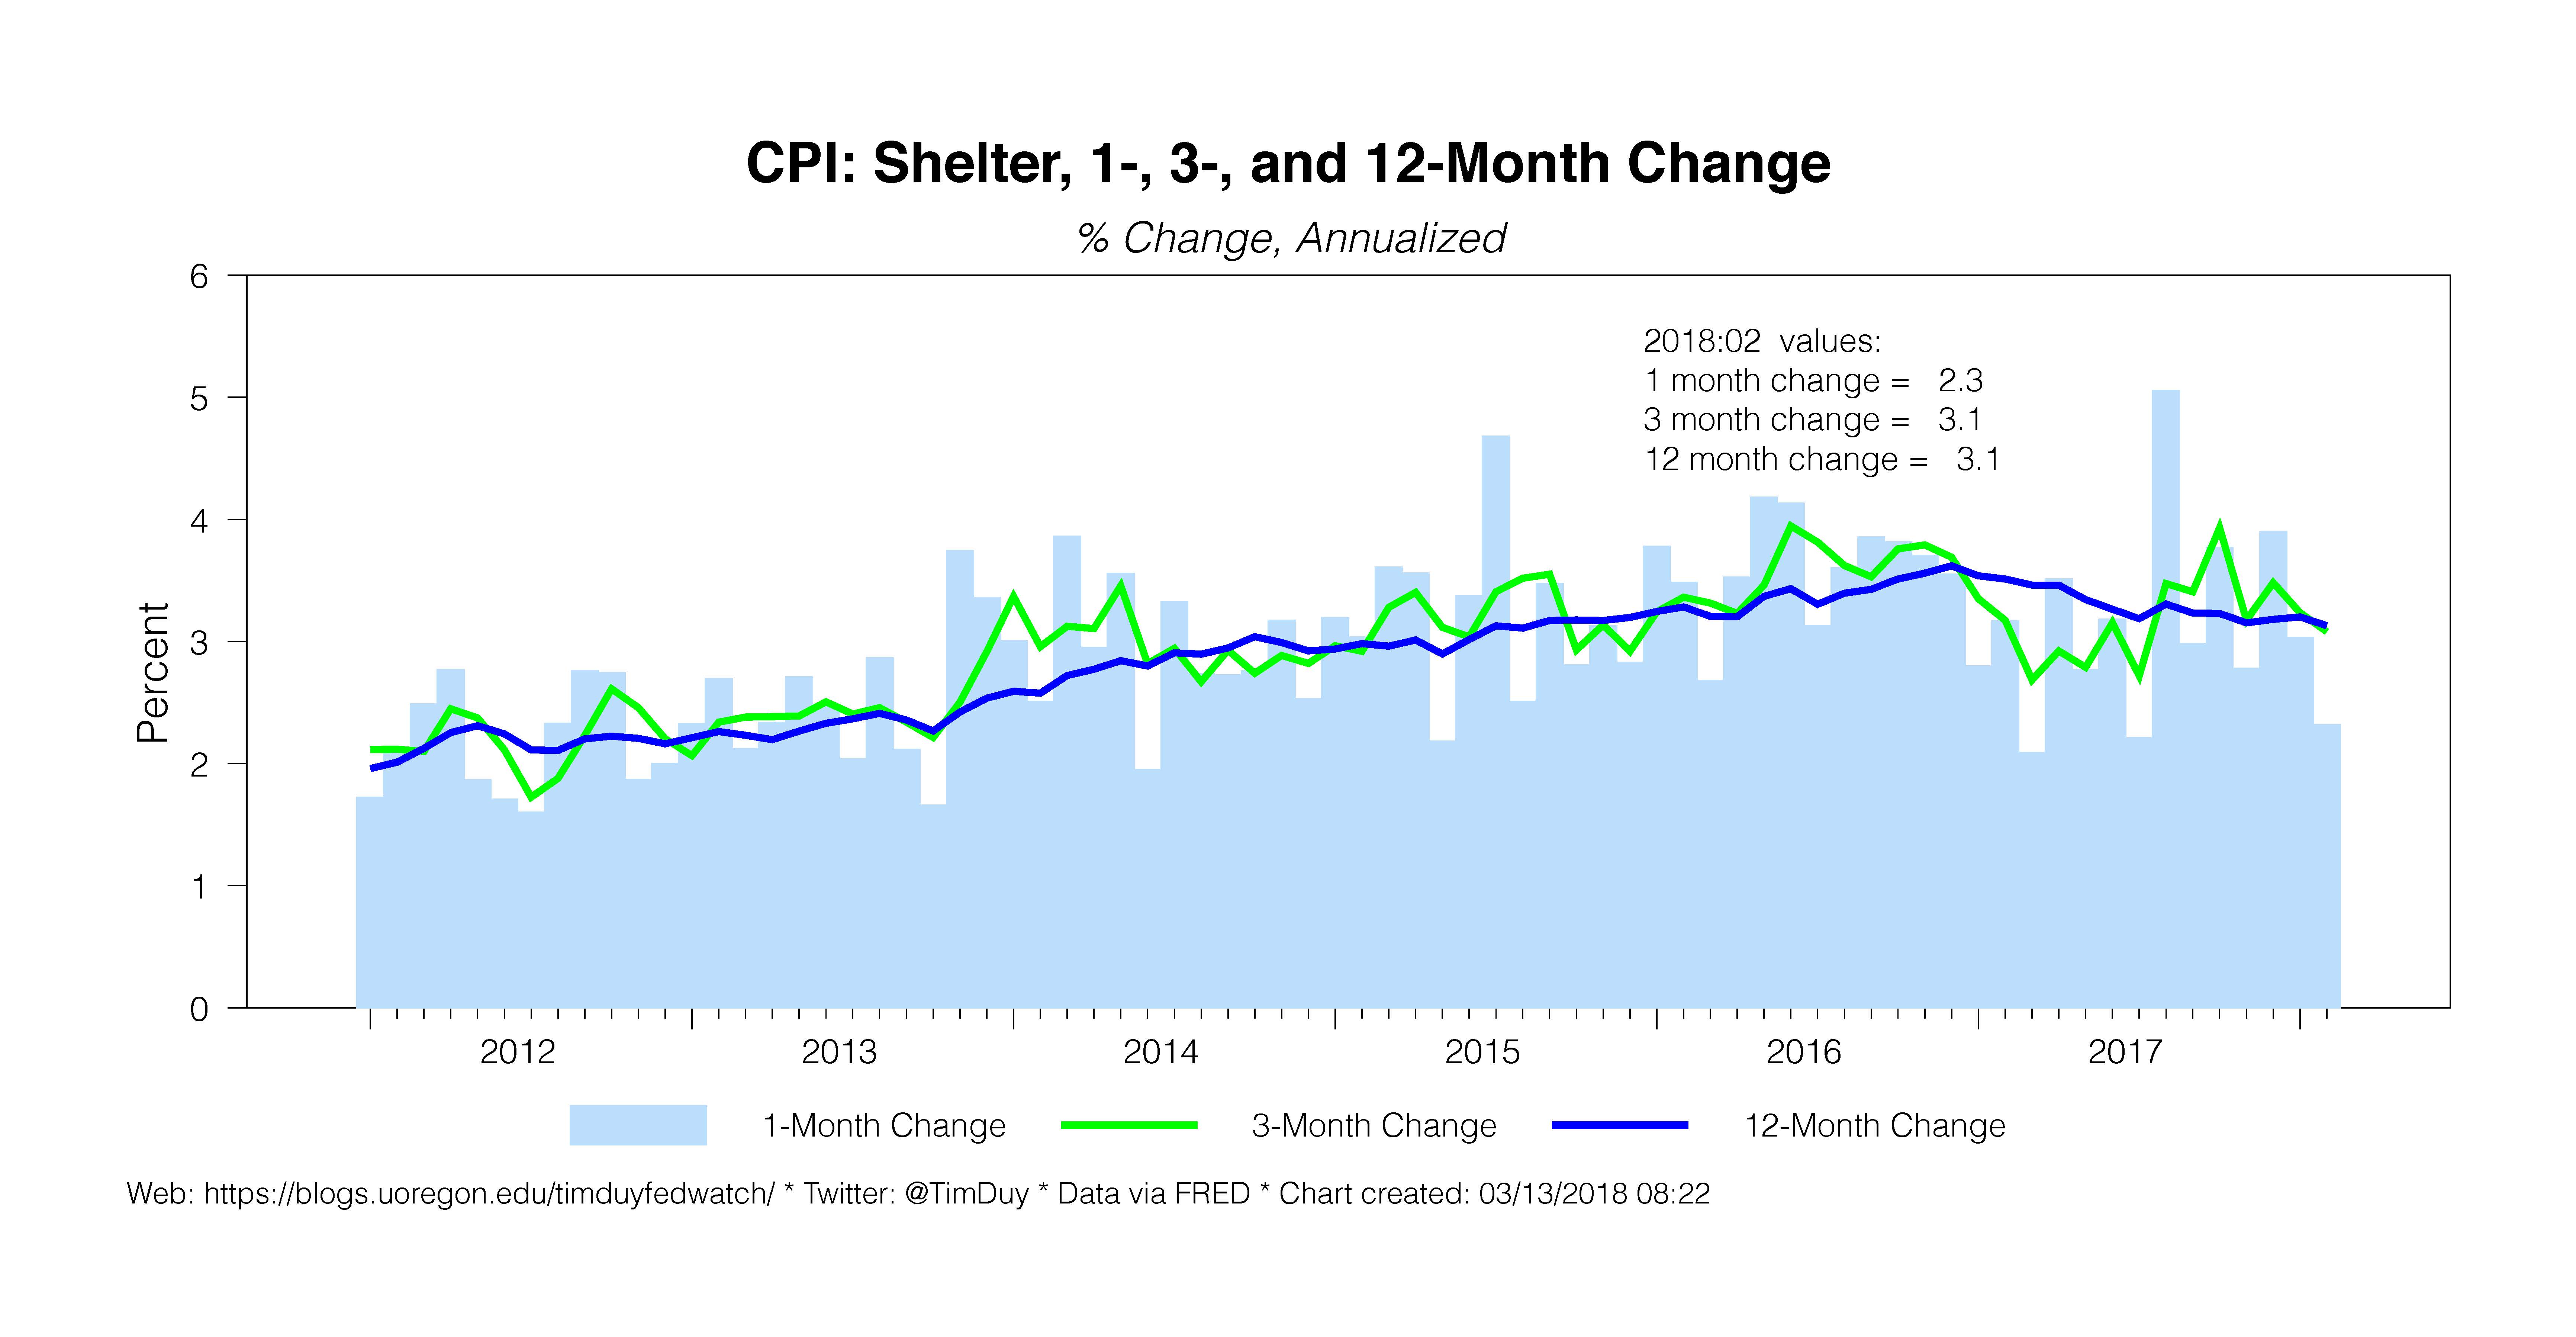
Bottom Line: Inflation numbers help confirm the Fed’s current forecast, but don’t signal any overshooting of their target yet. The Fed hence can’t yet place an accelerated pace of rate hikes on the back of actual inflation. Changes in the rate forecast instead remain attributable to risk management considerations as tailwinds threatens to push the economy into overheating that would reveal itself in either excessive inflation or financial instability.
December 2017 Oregon Regional Economic Indicators
Good morning. Attached is the University of Oregon Regional Economic Indexes for December 2017. The release date is today, March 13, 2018. We thank KeyBank for their generous support of this project.
Oregon Regional Economic Indicators:

Oregon’s major metropolitan areas finished 2017 on a strong note. Highlights of this month’s report include: Continue Reading
January 2018 Oregon Statewide Economic Indicators
This is the University of Oregon State of Oregon Economic Indicators for January 2018. The release date is March 8, 2018. Special thanks to our sponsor, KeyBank

The Oregon Measure of Economic Activity declined modestly to a still strong 1.43, down from a revised 1.69 the previous month. Highlights of this month’s report include:
- The moving average measure, which smooths out the volatility, is 1.34, well above average. (“zero” indicates average growth over the 1990-present period). All sectors covered contributed positively to the measure with particularly strong numbers in the household sector.
- The Oregon Department of Employment revised employment estimates for last year, the impact of which smoothed the pattern of activity in this measure while retaining the qualitative story that the Oregon economy gained steam in the latter half of last year.
- The University of Oregon Index of Economic Indicators also rose in January, gaining 0.2 percent. Similar to December, initial unemployment claims again fell to a fresh low while employment services (mostly temporary help workers) rose. These indicators suggest that labor markets remain strong even as the economy approaches the ninth anniversary of this expansion.
- Building permits (smoothed) were effectively unchanged for the month at a level consistent with previous expansions. Consumer confidence also held nearly steady at a high level.
- Hours worked in manufacturing and new orders for core capital goods fell slightly, but the Oregon weight distance tax rose to a new high for the cycle, indicating continued growth in Oregon’s traded-goods sectors.
Together, these indicators suggest ongoing growth in Oregon at an above average pace of activity.
Media Contacts:
Tim Duy – 541.346.4660 (w)
