Economic Forum and July Statewide Economic Indicators

Please stay safe as our state struggles with this historic wildfire season.

Economic Forum

We are once again partnering with the SEDCOR in Salem for a virtual Economic Forum next week. I hope you can join me and Oregon’s state economist Mark McMullen as we dissect the national and state economies next week, September 16th at noon. Registration is free (although donations are welcome!). To register, please visit:

https://us02web.zoom.us/webinar/register/WN_6eUuq-XHQ-G0Da7Akth5lw

We look forward to being able to return to in-person events after the Covid-19 pandemic ends.

Monthly Recession Dating Indicators

Statewide Economic Indicators

Below is the University of Oregon State of Oregon Economic Indicators for July 2020. The release date is September 10, 2020. Special thanks to our sponsor, KeyBank

Link to full report (with charts!) here.

The improvement in the UO economic indicators suggest the end of the technical recession is in sight although the pace of the subsequent recovery remains in question.

Highlights of the report include: Continue Reading

June 2020 Regional Economic Indicators

Good morning.  Below is the University of Oregon Regional Economic Indexes for June 202o. The release date is August 25, 2020. We thank KeyBank for their generous support of this project.

Link to full report (with charts!) here.

Oregon Regional Economic Indicators:

Regional indexes were all positive in June as employment continued to rebound while economies gradually reopened. Highlights of this month’s report include:

  • Moving average measures, which smooths monthly volatility, remained negative (the moving average measures still include the very weak month of April).
  • Leisure and hospitality employment made a particularly strong contribution across regions; the sector had been one of the hardest hit by the initial shutdowns. Even after two months of job growth, the sector is a long way from recovery; statewide through July, leisure and hospitality has only recovered half the jobs lost in March and April.
  • Overall, the labor market remains distressed as revealed by high unemployment rates and high levels of initial unemployment claims, both of which contributed negatively to the measures.
  • Interestingly, housing activity remains very resilient. New permits made nearly neutral contributions in most regions; the Bend area had a solid positive contribution. Residential sales are also holding strong.
  • I believe regional economies are still adjusting from the push-pull of the shutdown and reopening and have yet to establish a new post-pandemic base.

Media Contacts:
Tim Duy – 541.346.4660 (w)


June 2020 Oregon Statewide Economic Indicators

This is the University of Oregon State of Oregon Economic Indicators for June 2020. The release date is August 4, 2020. Special thanks to our sponsor, KeyBank.

Link to full report (with charts!) here.

The Oregon Measure of Economic Activity rose in June to 0.41 from a downwardly revised -0.23 in May. Despite the gain over the past two months, the moving average measure, which smooths out the volatility, stands at -4.56, mired deep below average growth for the Oregon economy (0.0 on this scale). Highlights of the report include: Continue Reading

Oregon Regional Mobility Leveling Off

Good morning! Thank you for subscribing to these reports, and special thanks to KeyBank for sponsoring our work.

An inability to get updated data has delayed the latest release of the Regional Economics Indicators; the Oregon Statewide continues to be released regularly with an update coming this week.

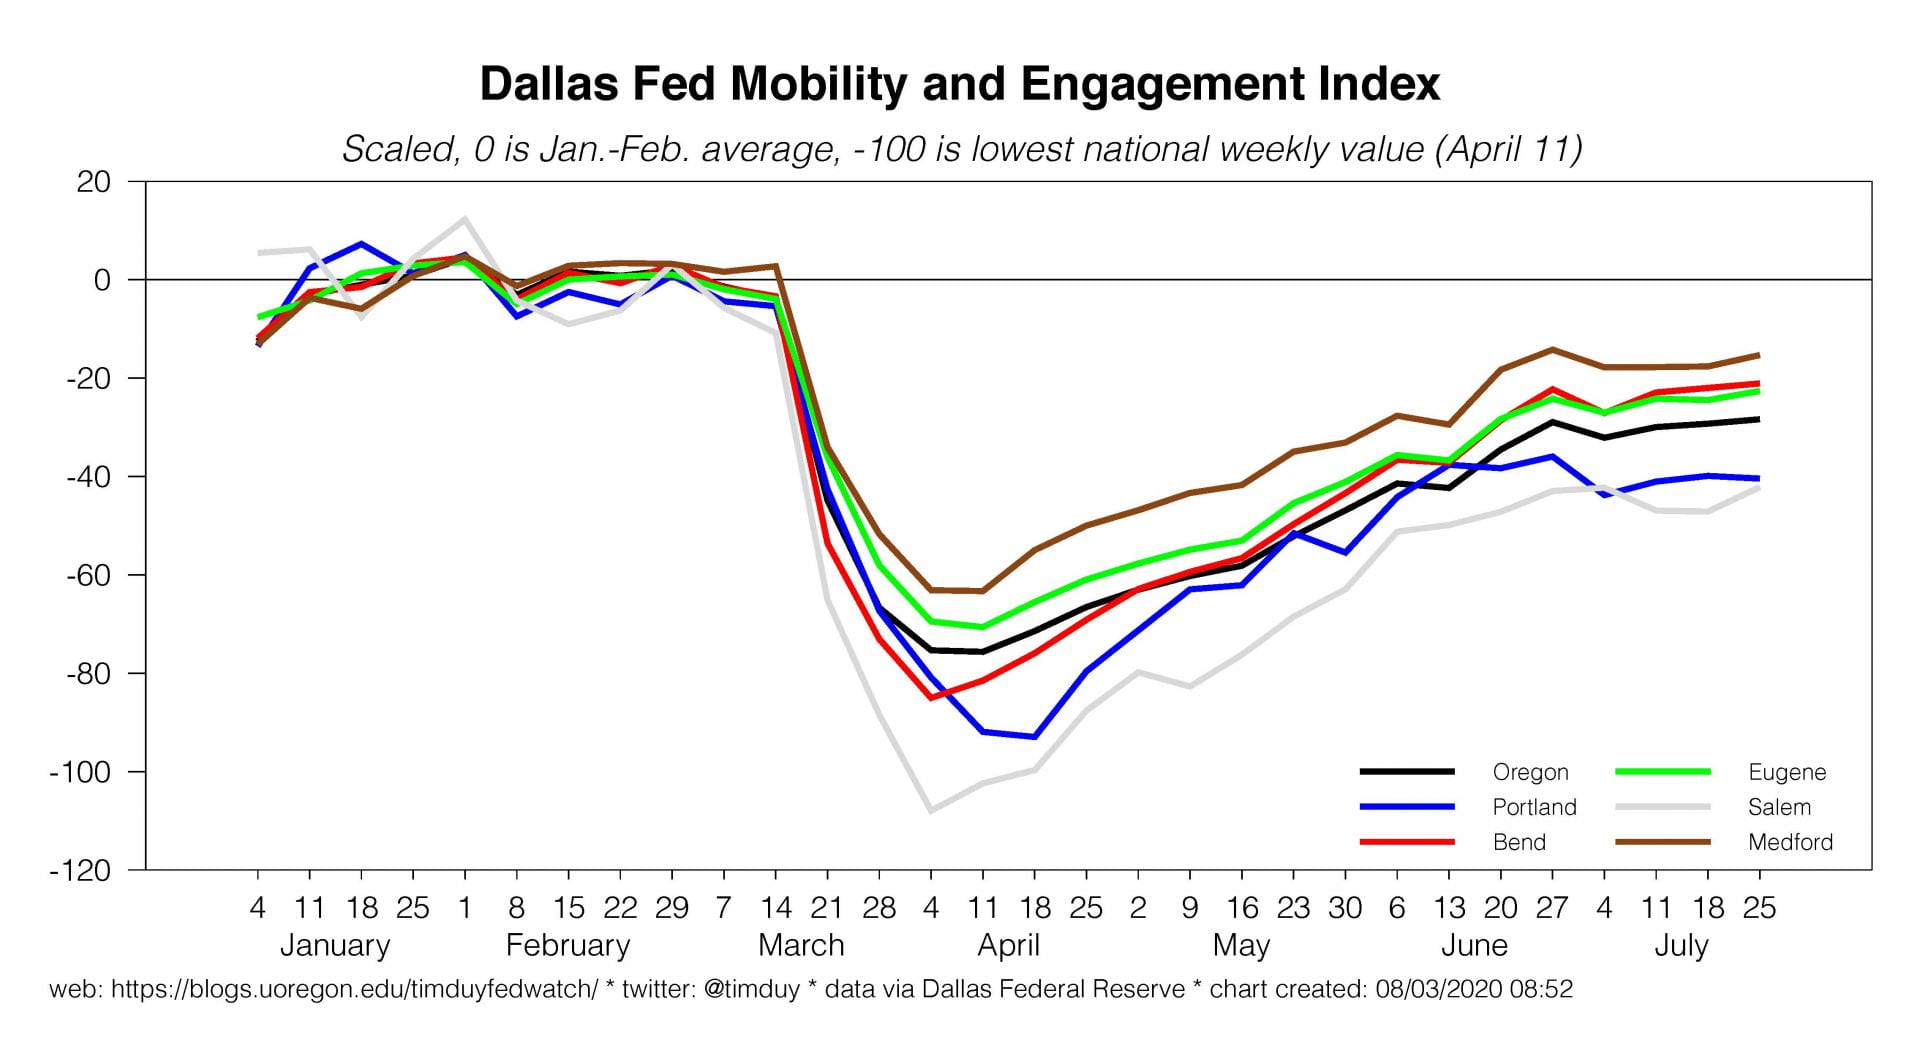
While I wait for the delayed data, I want to share some insights gained from the Dallas Federal Reserve Mobility and Engagement Index (MEI). The MEI uses mobile device data to track the extent to which people are traveling aways from their homes. The greater the mobility, the more likely that people are engaged in more normal types of economic activity. The MEI is scaled such that 0 is the average of January and February and -100 is the lowest level of mobility (April 11) for the nation. More details in the MEI’s construction can be found here.

The data is available by state, county, and metropolitan service area. For Oregon and it’s major metropolitan areas, the data reveals a fairly wide dispersion of mobility and engagement outcomes but all share the similar pattern of leveling off in the latter half of June and July:

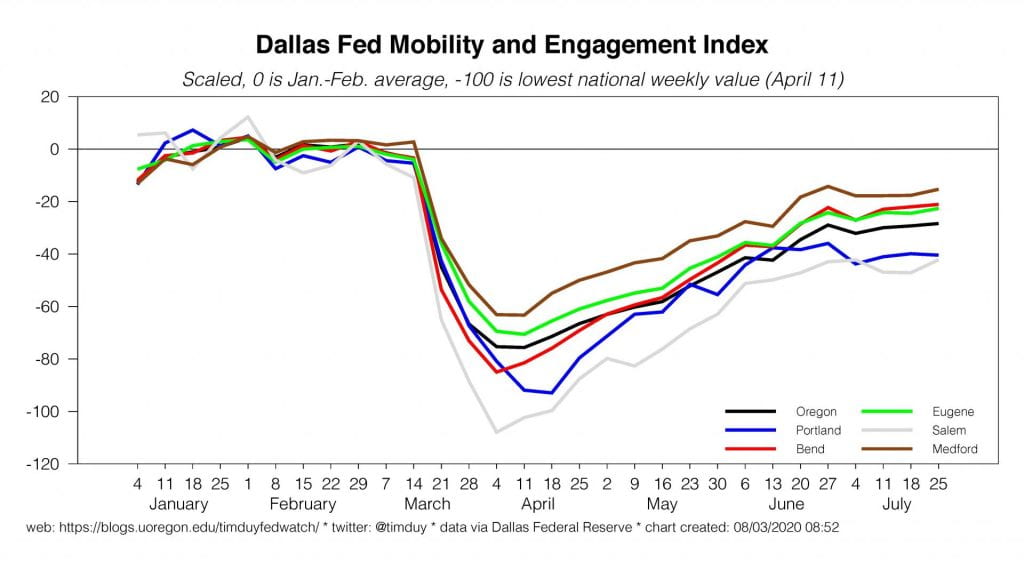
The Medford area has retained the most mobility and engagement with a July 25 reading of -15.3. This compares with the Portland and Salem areas with values of -40.3 and -42.2, respectively. Bend and Eugene are also similar to each other at -21.1 and -22.6, respectively.

There are two broad takeaways from these data. The first is that the recovery is progressing more slowly in Salem and Portland compared to other parts of the state. Note that the Multnomah, Washington, and Clackamas are still in Phase 1 status and the proximity of these regions to Marion County may impact activity there as well. This would explain the relativeness weakness of the Portland and Salem areas. The remaining areas are all in Phase 2 of reopening.

The second takeaway is that the pace of improvement in all areas has either slowed or leveled off in recent weeks. The trend has been evident in other areas of the nation as Covid-19 cases have climbed; where either due to renewed business closures (such as that ordered for Umatilla County) or increased caution on the part of individuals, we see less mobility and likely less economic activity.

More generally, mobility and engagement is not likely to return to its pre-pandemic levels until we have greater containment of the virus or an effective therapy or vaccine. Until that time, some parts of the economy, in particular leisure and hospitality, can’t yet fully recover and thus there will be a limit to the extent of the overall recovery.

May 2020 Oregon Statewide Economic Indicators

This is the University of Oregon State of Oregon Economic Indicators for May 2020. The release date July 6, 2020. Special thanks to our sponsor, KeyBank

Link to full report (with charts!) here.

The Oregon Measure of Economic Activity rebounded from -14.7 in April to 0.07 in May while the moving average measure, which smooths out the volatility, edged down further -5.23 and indicates below average growth for the Oregon economy. Highlights of the report include: Continue Reading